Gallery of publications with a key figure or image, an interesting take away, and a link. Just want the text citation list? Scroll to the bottom. Clicked a link and hit a paywall? Contact me for a pdf.

Han et al., 2024 Earth and Planetary Science Letters
In this (open access!) paper, we use a combination of techniques to characterize the sedimentary rocks of the Doushantuo Formation (Yangtze Gorges Area of modern-day China). The Doushantuo is widely considered a leading candidate for recording the first emergence of animal life on earth, making the understanding of the environment in this area coincident with these early fossils essential to understanding the evolution of life on Earth. Here, we build on our earlier assertion that animal life emerged into a lagoon and use a mix of chemical and geological methods to demonstrate the expansive extent of the lagoon in this location during the Ediacaran (following the extensive global ice coverage of the Marinoan Glaciation). We further demonstrate the importance of the formation of clay minerals during this time in balancing Earth’s carbon cycle in the absence of biological sinks of silica.

Han et al., 2022 Frontiers In Earth Science
Can SEM-EDS produce quantitative mineralogical data? YES it can! Here we demonstrate the importance of being able to identify multiple minerals per pixel (a mixel!) and the study area size in obtaining quantitatively reliable mineralogical data. Furthermore, we show how this pairing of accurate mineral maps with SEM imaging allows advancements on many intractable questions in Earth System Science through a series of case studies. These case studies look at not only the ability to identify mineral origin, but also target operational questions such as phases targeted in sequential leaching.

Abbott et al. 2022, GCA
We look at the influence of changing detrital composition on both bulk and authigenic neodymium isotope records in new records from IODP cores in the North Atlantic as well in published values from every ocean basin. We find that detrital shifts correlate well to isotopic shifts in the authigenic record, and the changes in the authigenic record may be exaggerated relative to the bulk if the phase is particularly prone to leaching methods. We propose that the similarity between authigenic and detrital records is either due to lithogenic overprinting of the authigenic signature in the sediment column itself OR a strong benthic flux altering the bottom water to resemble the detrital, and consequentially the authigenic phases as well.

Han et al., 2022 Communications Earth & Env
Here we use a novel approach based on SEM-EDS mineral maps to be able to distinguish detrital from authigenic clay minerals to answer the long standing question around what type of environment saw the emergence of animal life? The Doushantou Formation (modern China) hosts fossils considered candidates for the earliest animal life (metazoans), but the depositional environment has been heavily disputed. By being able to confidently say the saponite (a Mg rich clay) present in this formation was formed in situ (authigenic) combined with other geochemical evidence we conclude this was a restricted lagoon.

Janssen et al. 2021, EPSL
With the pore water section of this paper based around samples collected on RV Investigator in 2018, this is one of those collaborations that happens when you bring together different research interests on a ship! We find that Cr in porewater is significantly elevated relative to bottom water meaning that a benthic flux is likely important to the oceanic budget for Cr (locally, and potentially globally). Based on isotopes and phase-specific concentrations, it looks like the benthic flux for Cr consists mainly of Cr that was scavenged by particles in the water column, rather than ‘new’ Cr from lithogenic dissolution.

Du et al. 2022 Earth and Planetary Science Letters
Here we present the results of reactive-transport modeling of neodymium in the pore water as a way to understand the major processes driving the pore water profile and consequently the benthic flux. We test what are likely to be the major influences (not feasible to test all possible processes) including the role of clay formation, silicate dissolution, oxide formation/dissolution, and phosphate cycling using both a co-precipitation framework and a reverse scavenging framework. Co-precipitation is able to reproduce the observed pore water profiles from HH3000 (see Abbott et al 2015) but reverse scavenging is not.

Arthur et al. 2021, Frontiers In
Here we look at the role of a National Research Facility in enabling and promoting increased scientific literacy of the wider population. The paper looks at each of RV Investigator’s outreach and education initiatives, including CAPSTAN, in terms of target audience, time commitment, and numbers impacted. This variation in resource intensity and target audience we find to be essential in a successful, multi-faceted marine education approach. In addition to case studies, we also generalize the information needs of each audience from simple to complex and what programs meet each need.

Abbott 2019, Geology
My first paper with data from RV Investigator! Using pore water and water column data from a 2016 voyage in the Tasman Sea, I demonstrate that the concentration of neodymium in Circumpolar Deep Water nearly doubles within ~10 degrees latitude as it moves through the Tasman Sea – this is not conservative behavior! I also show that there is a significant benthic flux in this region, despite being dominantly calcareous sediments. Based on diffusion calculations, the benthic flux from these sediments is about the same as the fluxes we estimated in the North Pacific!

Abbott et al. 2019, Frontiers In
Knowing that the benthic flux from the North Pacific and the Tasman Sea is a similar magnitude based on the pore water let us take a closer look at the sediments to better understand what mineral phase(s) may have an important role in driving this process. The ‘authigenic’ neodymium, the most commonly used type for paleo-reconstructions is operationally defined – obtained by set leaching protocols. Through these processes, we know that the neodymium usually is released from the sediments in association with an iron-rich phase? Oxyhydroxides? Maybe, but the SEM images don’t support this assumption. Instead, we see that most of the iron is associated with clay minerals – particularly glauconites, smectite, and some chlorites. The clays could release both iron and neodymium during leaching without the acids being able to break down the aluminosilicate base. Indeed, this conclusion is supported by the difference in REE patterns between the clays coming into the ocean (detrital) and the the clays forming in the sediment column (authigenic).

Abbott et al. 2016, EPSL
This paper really raised a lot of questions that subsequent papers have worked to address. How can the pore fluid at the 200 meter North Pacific site (HH200) be more radiogenic than any of the suspected sources of neodymium to the pore water (detrital, authigenic)? Why does the concentration of dissolved neodymium appear to correlate with sediment grain size (smaller grains = higher pore water neodymium)? In the paper, we invoke a cryptic phase – a sediment component too small to be detected by XRD but isotopically unique and reactive enough to have an influence on the pore water composition. Spoiler: our imaging of these sediments for Abbott et al. 2019 found volcanic shards, consistent with our original suggestion in this paper that the cryptic phase may be from the Cascadian arc! Number wise, the neodymium dissolved in the pore water is < 0.001% the neodymium in the solid phase so it makes complete sense that it would be susceptible to changes in the solid composition that easily remain under detection limits for the sediment. Furthermore, we found up to ~50% of the total solid neodymium could be released from leaching.

Haley et al. 2017, Frontiers In
Not quite sure what all the fuss is about in terms of whether or not sediments are a dominant source of rare earths to the ocean? This is the paper to check out! We go through the real-ocean observations of neodymium concentrations and isotope data that don’t quite make sense in the traditional “top-down” model for the ocean neodymium budget and argue that the “bottom-up” model provides better consistency with the existing data (both concentrations and isotopes!) thus favoring the benthic (sedimentary) source of rare earths as a dominant component in the oceanic budget. The paper also looks at the implications of this flipping of the neodymium budget on paleo-interpretations of neodymium isotope data and use of neodymium isotopes as an ocean circulation tracer.

Johnson et al. 2016, Nature
Using temperature and precipitation reconstructions from Lake Malawi sediment cores covering the last 1.3 million years, we show that southeastern Africa grew wetter through this period and the variability decreased in frequency to more prolonged wet and dry intervals. This is in contrast to the progressively drier conditions observed over the past few million years in records from Northern Africa! We also demonstrate that the temperature in this region over the past 500,000 years closely mimics changes in atmospheric carbon dioxide and terrigenous dust flux (in the Pacific Ocean). Like the rest of Africa, we observe a dominant 100,000 year climate signal (eccentricity) since the Mid-Pleistocene Transition. However, we don’t see the additional pronounced precession signature (20,000 years) that exists in more northern records.
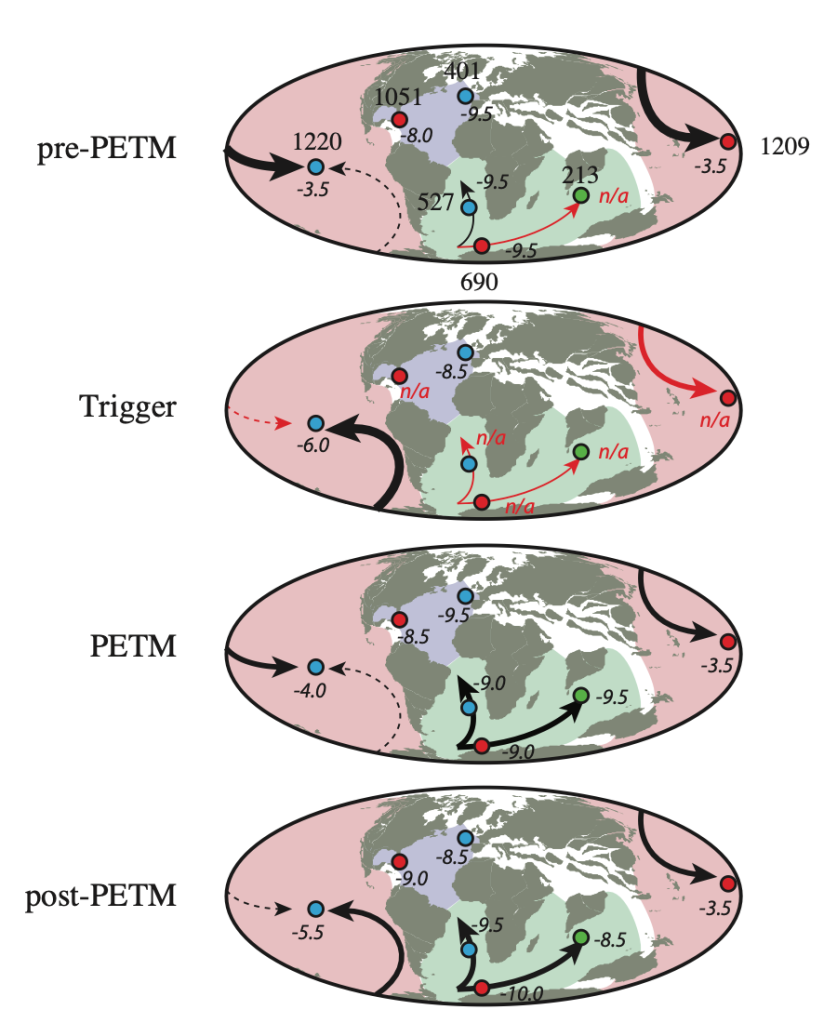
Abbott et al. 2016, Climate of the Past
Using neodymium isotopes as a paleo-circulation tracer (as has been done widely in the literature), we use data from 7 sites spanning across the Paleocene-Eocene Thermal Maximum (PETM, ~55 Ma) to examine if a shift in ocean circulation could have been an important trigger for the extreme warm event. Our data was consistent with models proposing an ‘on-off switch’ for formation of deep water in the North Pacific during this time with a strong deviation in Pacific neodymium isotope distributions immediately before the carbon isotope excursion that marks the PETM. Such a change in ocean circulation would alter the distribution/redistribution of heat around the planet and may also result in further warming through mechanisms such as the destabilization of methane clathrates.

Abbott et al. 2015, Geology
The first-ever measurements of neodymium isotopes in pore water!! If that’s not exciting enough, we found that these pore water isotope values are not the same as bottom water – challenging a long held assumption that it didn’t really matter where authigenic phases obtained their signature because pore water would be the same as bottom water from an isotopic standpoint. We also demonstrate that for the bottom water, the actual neodymium isotope composition is somewhere in between what is predicted for that water mass (as identified by temperature and salinity) and the pore water — supporting the idea that the isotopic composition of the bottom water is being altered by a benthic source. We model this in terms of bottom water isotopic evolution in the Pacific and find our estimated benthic flux magnitudes from Abbott et al. 2015 plus the observed isotope variation could explain the evolution in modern deep Pacific neodymium isotope values from South to North in the absence of deep water formation in the Pacific.

Abbott et al. 2015, GCA
This paper presents pore water rare earth element (REE) concentrations and patterns for eight sites along the Oregon-California margin. While we expected to see variation between sites correlated to water column oxygenation, instead we see progressively higher dissolved REE concentrations with increasing water depths (with the exception of station 2 but that’s a story you’ll need to go to the paper for). We also find that the pore water depths with the highest REE concentrations, have the REE profiles most depleted in heavy REEs (and generally the most similar to the local bulk sediment). We use the measured concentrations to calculate a diffusive flux from the pore water to the bottom water and demonstrate that if these observations are widely applicable across the global ocean, the benthic source of neodymium from the sedimentary pore water to the ocean could balance the neodymium budget (similar value to the neodymium amounts models identified as ‘missing’).
Citation List: (in reverse chronological order; or see on Google Scholar)
(*graduate student or **undergraduate student under my supervision at time of research)
Han S.*, Löhr S.C., Abbott A.N., Baldermann A., Shields G.A., Cui H., Kaufman A.J., Chen B., and Yu B. (2024) Authigenic clay mineral constraints on spatiotemporal evolution of restricted, evaporitic conditions during deposition of the Ediacaran Doushantou Formation. Earth and Planetary Science Letters, 626, https://doi.org/10.1016/j.epsl.2023.118524
Han S.*, Löhr S.C., Abbott A.N., Baldermann A., Farkaš J., McMahon W., Milliken K.L., Rafiei M., Wheeler C.**, and Owen M. (2022) Earth system science applications of next-generation SEM-EDS automated mineral mapping. Frontiers in Earth Science, 10:956912, https://doi.org/10.3389/feart.2022.956912
Du J., Haley B.A., Mix A.C., Abbott A.N., McManus J., and Vance D. (2022) Reactive-transport modeling of neodymium and its radiogenic isotope in deep-sea sediments: The roles of authigenesis, marine silicate weathering, and reverse weathering. Earth and Planetary Science Letters, 596, https://doi.org/10.1016/j.epsl.2022.117792
Han, S.*, Löhr, S., Abbott, A.N., Baldermann, A., Voigt, M., and Yu, B. (2022) Authigenic clay mineral evidence for restricted, evaporitic conditions during the emergence of the Ediacaran Doushantou Biota. Communications Earth & Environment, 3:165, https://www.nature.com/articles/s43247-022-00495-6
Abbott, A.N., Löhr, S., Payne, A.**, Kumar, H.**, and Du, J. (2022) Widespread overprinting of authigenic neodymium isotope records and its implications to bottom water εNd. Geochimica et Cosmochimica Acta, 319, 318-336. doi: https://doi.org/10.1016/j.gca.2021.11.021
Arthur, B.T., Roberts, D., Rae, B., Marrison, M., McCleary, H., Abbott, A., and Musso, B. (2021) Ocean outreach in Australia: How a national research facility is engaging with community to improve scientific literacy. Frontiers in Environmental Science special issue ‘Science, Marine Observations and Society: Pathways to Improve Public Engagement and the Science-Policy Nexus,’ 9, 610115. doi: https://doi.org/10.3389/fenvs.2021.610115
Janssen, D.J., Rickli, J., Abbott, A.N., Ellwood, M.J., Twining, B.S., Ohnemus, D.C., Nasemann, P., Gilliard, D., Jaccard, S.L. (2021) Release from biogenic particles, benthic fluxes, and deep water circulation control Cr and δ53Cr distributions in the ocean interior. Earth and Planetary Science Letters, 574, doi: https://doi.org/10.1016/j.epsl.2021.117163
Abbott, A.N., Löhr, S., and Trethewy, M.** (2019), Are clay minerals the primary control on the oceanic rare earth element budget? Frontiers in Marine Science, 6, 504, doi: https://doi.org/10.3389/fmars.2019.00504
Abbott, A.N. (2019) A benthic flux from calcareous sediments results in non-conservative neodymium behavior during lateral transport: A study from the Tasman Sea. Geology, doi: https://doi.org/10.1130/G45904.1
Haley, B., Du, J., Abbott, A.N., McManus, J. (2017), The impact of benthic processes on rare earth element and neodymium isotope distributions in the oceans. Frontiers in Marine Science, 4, 426, doi: https://doi.org/10.3389/fmars.2017.00426
Abbott, A.N., Haley, B., and McManus, J. (2016) The Impact of Sedimentary Coatings on the Diagenetic Nd Flux. Earth and Planetary Science Letters, 144, 217-227. doi: https://doi.org/10.1016/j.epsl.2016.06.001
Johnson, T.C., Werne, J.P., Brown, E.T., Abbott, A., Berke, M., Steinman, B.A., Halbur, J., Contreras, S., Grosshuesch, S., Deino, A., Lyons, R.P., Scholz, C.A., Schouten, S., and Sinninghe Damsté, J.S. (2016). A progressively wetter climate in southern East Africa over the past 1.3 million years. Nature, 537, 220-224 doi https://doi.org/10.1038/nature19065
Abbott, A.N., Haley, B.A., Tripati, A.K., and Frank, M. (2016) Constraints on ocean circulation at the Paleocene-Eocene Thermal Maximum from neodymium isotopes. Climates of the Past, 12, doi: https://doi.org/10.5194/cp-12-837-2016
Abbott, A.N., Haley, B., and McManus, J. (2015) Bottoms up: Sedimentary control of the deep North Pacific Ocean’s εNd signature. Geology, 43, 1035-1038. doi: https://doi.org/10.1130/G37114.1
Abbott, A.N., Haley, B., McManus, J., and Reimers, C., (2015) The sedimentary source of dissolved rare earth elements to the ocean. Geochimica et Cosmochimica Acta, 154, 186-200 doi https://doi.org/10.1016/j.gca.2015.01.010

