In the first post looking at Han et al. (2022) (What is in the sediments?), I mention that the location selected for the region of interest (ROI, the smaller subset of the sample that we analyze using EDS after completing an overview backscatter image on the SEM) is an important component in determining what the quantitative mineralogical results actually tell us – particularly in heterogenous samples. This step is entirely user-dependent and deserves explicit discussion. In the paper, we conclude that ROIs in a column like orientation, perpendicular to bedding) are most comparable to the bulk mineralogy results from XRD. Seems simple enough, but there’s a bit more to it.
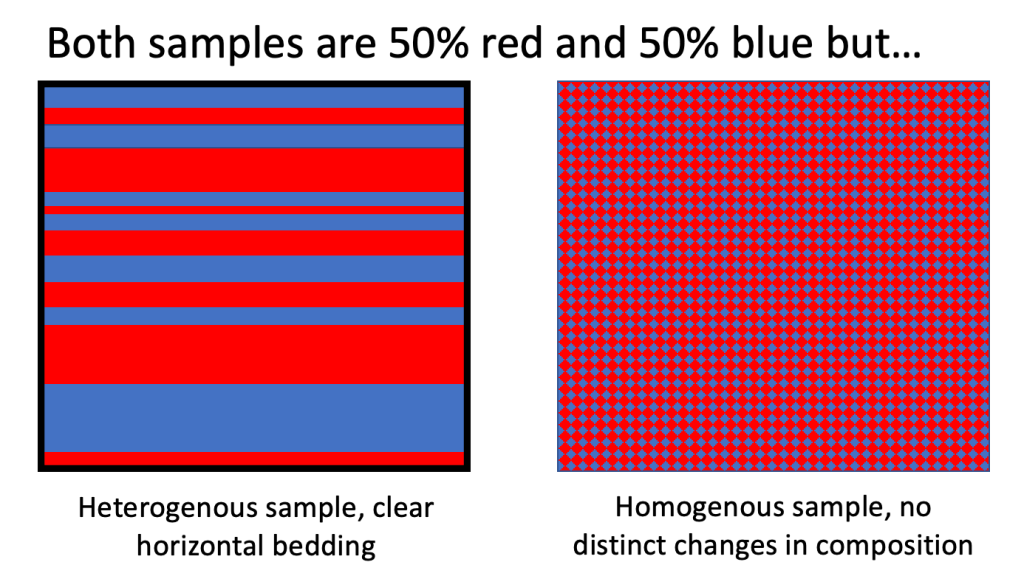
To start, we need to at least briefly talk about what ‘bulk’ samples can and cannot tell us. ‘Bulk’ can be thought of as a total – it considers everything within the sample and by definition masks any internal differences (heterogeneity). We often talk about ‘bulk chemistry’ where we dissolve the whole sample and measure the resulting solution – similar idea here, for XRD we homogenize the sample and look at the whole as a single measurement. While appropriate for some applications, bulk doesn’t tell the whole story. For example, in the sediments where we have dissolution and precipitation taking place, we could have the same bulk chemistry despite a changing mineralogy (plenty more on this to come with some other projects that are in the works). To illustrate this, bulk measurements would return the same measurements for both of the below samples – but if we consider their appearance they are actually quite different.

So if we take a heterogenous sample with bedding, such as represented by the above schematic on the left, to replicate bulk mineralogy (i.e. to match XRD mineralogy results) we need to select long rectangular ROIs that are perpendicular to the beds. Doing so, with ROIs of 1 mm² gives us quantitative results comparable to XRD. But here is where we have to consider the question we want to answer. We aren’t limited to the bulk sample, we can ask more detailed questions – we can look for differences in mineralogy between the beds by aligning our ROI parallel to the bed.

Take for instance the image above. The black vertically elongated boxes (perpendicular to the bedding) would produce quantitative mineralogy comparable to XRD results. But, if instead we want to understand variability between the beds, we could select a different orientation for our ROIs. The white box would allow us to characterize the phosphorous rich layer (shown on the background SEM-EDS mineral map by pink coloration) and the yellow box would allow us to characterize the more clay rich layer (shown on the background SEM-EDS mineral map by green coloration). Similarly, if we had a sample that had patches of clay and patches of silt we could select ROIs that allowed us to compare the mineralogy of the two different grain size components. Another application could be looking at the difference between ice rafted debris (the larger grains) and the background fine grained sediment from the glacial North Atlantic sample shown below.

Ok, now that we’ve had an overview of the technology (What’s in the sediments?) and understand a bit more about why ROI orientation and shape matters, let’s look at some of the cool earth science applications of this technique in Part 3: Earth Science Applications of Mineral Mapping!
Citation: Han S., Löhr S.C., Abbott A.N., Baldermann A., Farkas J., McMahon W., Milliken K.L., Rafiei M., Wheeler C., and Owen M. (2022) Earth System Science applications of next-generation SEM-EDS automated mineral mapping. Frontiers in Earth Science, 10:956912. doi 10.3389/feart.2022.956912
One thought on “Matching Methods”