In our Frontiers In paper led by Shujun Han, we present results demonstrating that SEM-EDS can produce reliable quantitative mineralogy results that are comparable to XRD while retaining the textural and spatial context possible with such high-resolution imagery. In the paper, we go through several case studies looking at how this technological advancement can help answer some outstanding questions in Earth System Science and some of these are the focus of this post (check out the paper for more!). Check out part 1 (What’s in the sediments) for a deeper dive into the tech and part 2 (Matching Methods) if you want to learn more about how selecting the region to analyze is important to being able to answer the research questions.

Where did that mineral form?
There is an incredible number of unresolved questions in earth science where the heart of the debate rests with the inability to distinguish between authigenic and detrital minerals. Take for example, Shujun’s recent Communications Earth and Environment paper (Han et al. 2022a) – the Doushantou Formation in present-day China is thought to hold some of the oldest fossil evidence of animal life (metazoans) but the environment in which it was deposited was undecided, largely because of the presence of a magnesium rich clay mineral- saponite. Why was saponite so problematic for interpretations of the Doushantou? Well, some of the geochemistry (e.g. seawater like isotope records) were suggesting the formation had to be from an open marine environment- but there are no modern open marine environments that allow for the precipitation of authigenic saponite, so how could this be? Some argued this must mean that the Doushantou was not an open marine environment- maybe a lake instead. But others said the saponite must have just washed in from elsewhere, detrital saponite would say nothing of the environment in which it was found (other than perhaps proximity to a source).

Using the same method we describe in this paper, we were able to show that the saponite of the Doushantou is almost entirely authigenic – meaning that the depositional environment was not open marine but was also not likely to be a lake. Instead we suggest it was deposited in a lagoonal setting, heavily restricted in its exchange with the ocean (blog post: geochemistry and life; paper: Han et al. 2022a). And you’re timely reminder that if you can’t access a paper (many journals have pay walls), just ask one of the authors! They are allowed to share the file with you (for free) and are generally overjoyed by your interest in their work!
This application has much potential! Between Shujun, Cassandra, and Ananyaa stay tuned for a lot more in this space 🙂

Leach what?
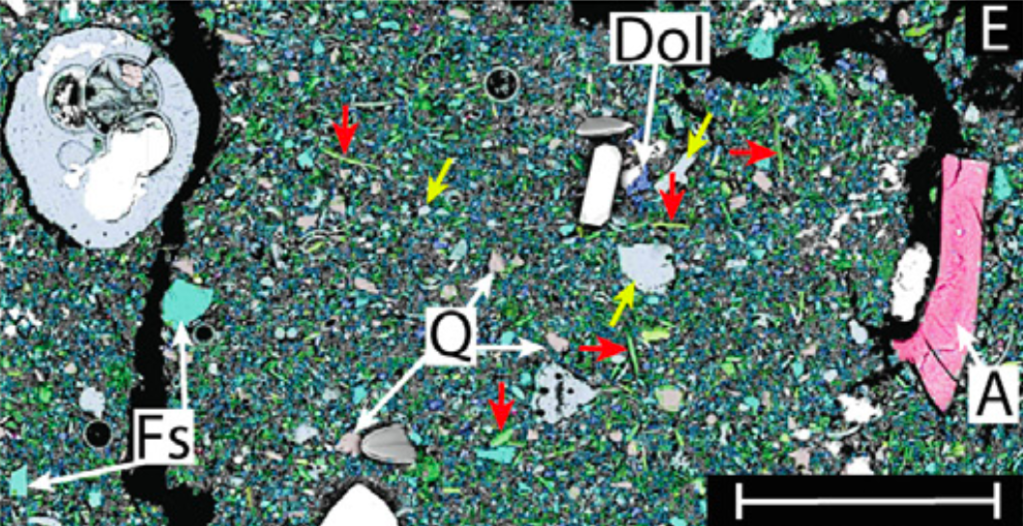
Leaching… If you’ve been reading my posts (or my papers) for a while then you’ve heard me complain about this. The idea of leaching is that you expose sediments to a chemical solution that targets a desired phase – e.g. a weak acid may be used to dissolve authigenic calcite – then you collect the resulting solution for analyses. This practice is quite common as for many applications you need one component of the sediments or another, and there aren’t a lot of other options. Recognizing these complications are important to interpreting the results. So, what are you really measuring? It is an ‘operationally defined’ result – that is, you may call it a ‘calcite leach’ but realistically what is in the solution is anything and everything targeted by that weak acid. For example, in our 2019 Frontiers paper we argue that this ambiguity with leaching is why rare earths have been linked heavily to iron oxides despite a lack of visible iron oxides in the sediments – the common leaching methods are reductive so can release both rare earths and iron from iron-rich clays. So how can SEM-EDS help? On the most simple level, we can use SEM-EDS to better understand what the potential targets are in the sediments- what phases are present? Where are there compositional shifts? Are there components that may bias a particular leaching step (see Abbott et al. 2022 for an example of how chlorite rich ice rafted debris could bring with it a very negative isotope signature). Going further, we can even image samples before and after each step of a sequential leaching procedure, then compare the results – what sediment components were targeted (i.e. disappeared or reduced) during the leach?

The devil is in the details.
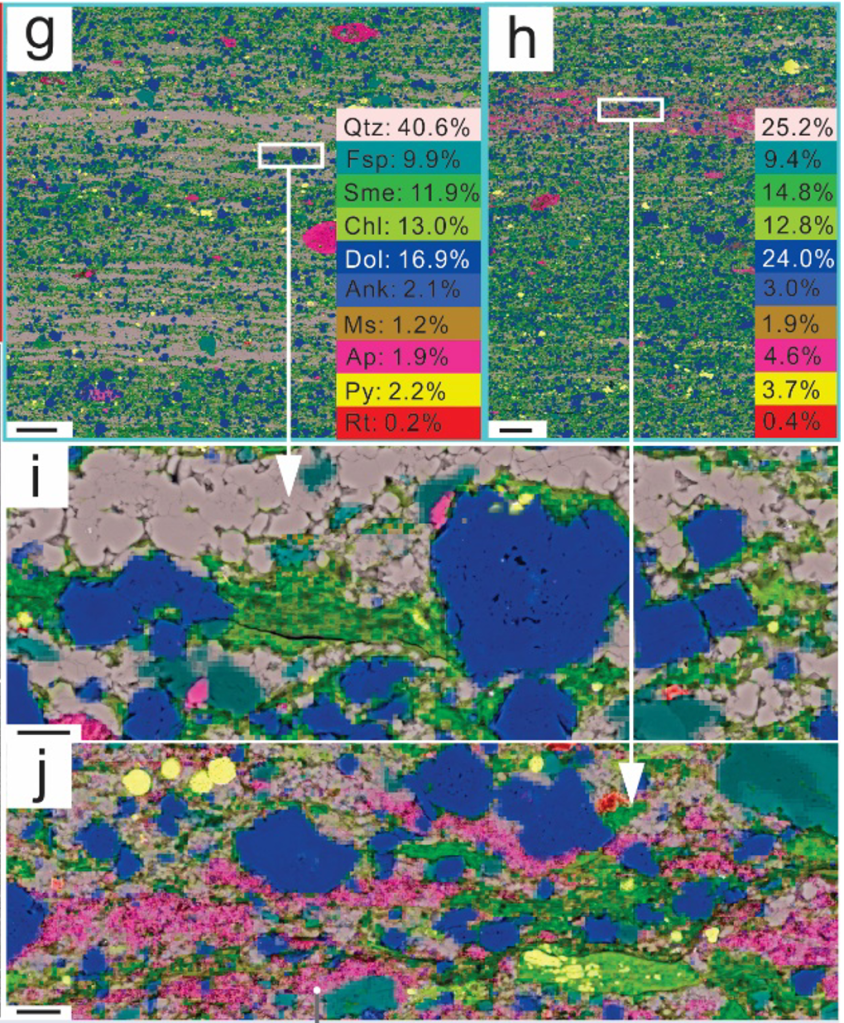
Often you’ll see fine-grained sedimentary rocks such as shales treated as homogenous – but we know that laminae are widely reported and readily recognizable. Compositional variation for these laminae, particularly in shales is rarely documented (logistically this has been near impossible to date given the small size of such features) – but these compositional comparisons hold important information in terms of interpreting depositional environments, reservoir properties, age, and even subsurface flow. But since SEM-EDS does produce quantitative results, we can now measure laminae only a few microns thick using targeted regions of interest (see Matching Methods)! Check out the paper for a deeper dive into how this has already improved our understanding of the Permo-Carboniferous Stuart Range formation from Southern Australia and the Eocene Bohai Bay shales from China.

Well, that’s it folks! Check out the paper for more info and reach out with any questions!
Citation: Han S., Löhr S.C., Abbott A.N., Baldermann A., Farkas J., McMahon W., Milliken K.L., Rafiei M., Wheeler C., and Owen M. (2022) Earth System Science applications of next-generation SEM-EDS automated mineral mapping. Frontiers in Earth Science, 10:956912, doi: 10.3389/feart.2022.956912